Mastering the Right Toolbar in SiteMap®
Managing subsurface utility data and facility maps is only part of the job. The real advantage comes when you can navigate, measure, and organize that information inside a platform built for action. Whether your workflow leans on CAD, GIS, or a mix of both, the right toolbar in SiteMap® gives you the tools to visualize, filter, and share accurate records. In this guide, we will walk through each feature, so you and your team can turn complex data into clear, interactive solutions.
What the Right Toolbar Does
The right toolbar is your control center for viewing, measuring, and managing site data. It appears automatically when you open SiteMap and works on both desktop and mobile. These tools help you keep clean records, use the software efficiently, and deliver fast solutions with your GIS system.
Watch the full Feature Friday recording here to see the toolbar in action.
Layers: See the Right Data at the Right Time
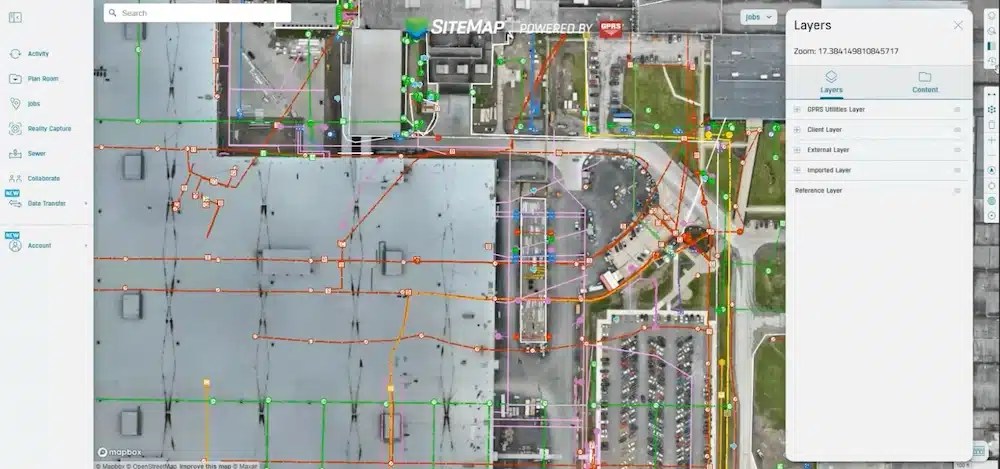
The Layers panel in SiteMap makes it easy to organize utility data and imported files for a clear, interactive view of your facility.
Layers are what make SiteMap truly interactive. Instead of staring at a cluttered map, you can zero in on exactly what matters for the job at hand. Think of layers as your way to filter the noise and focus on the details that keep your project moving.
Start with GPRS Utility Layers. These include communication, electrical, fire, water, sanitary, storm, and more. Having all utilities visible helps you plan safely and avoid surprises. You can still group or highlight specific types, like electrical and communication lines, when planning a fiber upgrade. This way, you keep everything else in view for context.
Imported Layers unlock even more flexibility for Pro users. You can bring in drone imagery from recent flyovers, reference CAD drawings, or add as-built PDFs into your map. These files stack on top of your existing data, creating a single, unified view. For added clarity, you can adjust the transparency to compare before-and-after conditions. This feature is ideal for tracking construction progress or validating changes on-site.
Content: Access Your Project Files Fast
The Content panel is your shortcut to every file tied to your project. Instead of digging through email chains or shared drives, everything you need is in one place. From KMZ files for Google Earth to detailed PDFs and XLS spreadsheets with coordinates, SiteMap keeps your records easy to find and ready to share.
This feature is valuable for facility managers who need quick access to accurate data during planning or fieldwork. Whether you’re verifying a locate, preparing for a contractor meeting, or updating your GIS system, having these files at your fingertips can save time. SiteMap ensures you’re always working with the latest information.
History Slider: Filter Your Work by Date
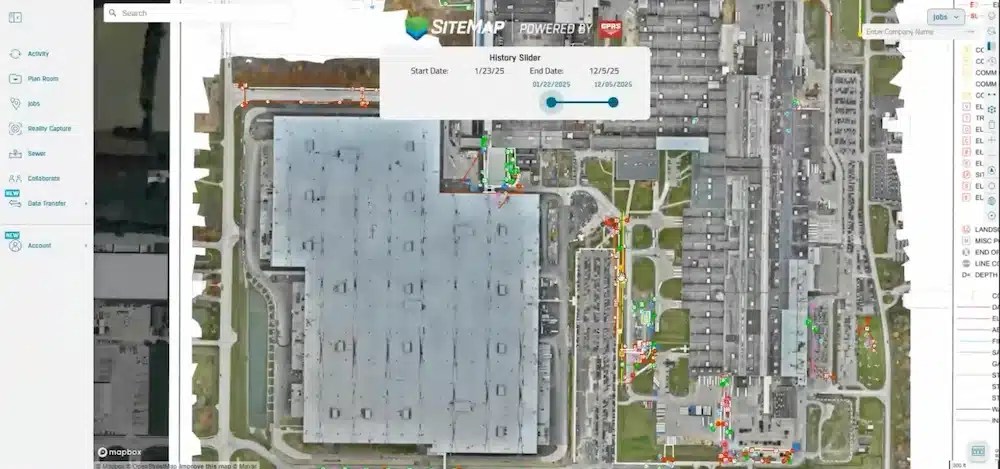
The History Slider in SiteMap lets you filter utility data by date range, making it easy to review past work and track changes over time.
The History Slider is a powerful tool for managing time-based data in SiteMap. You can filter line work by date range. This helps you focus on the most important projects. You can review last month’s locate or plan for next year’s expansion.
For facility managers, this feature is invaluable during audits and progress checks. Slide to a specific timeframe and see only the work completed during that period. Adjust the slider to focus on a specific time frame and compare historical data with current conditions. This is a straightforward way to ensure your GIS system remains accurate and your records are organized.
Measuring Tools: Distance and Area in Seconds
The measuring tools in SiteMap make quick checks simple and accurate. You can calculate distances and areas right inside the platform. No guesses or tape measures required. These tools are perfect for planning, estimating, and verifying work without leaving your map.
Line String
Use the line string tool to measure the distance between two points. Click once to start, click again to finish, and SiteMap gives you the measurement. This is ideal for checking how far a utility line runs across a property or confirming clearance between features before excavation.
Polygon
For area measurements, draw a polygon around the space you want to calculate. SiteMap provides the square footage. This information is useful for estimating materials, planning scan coverage, and confirming project boundaries.
Zoom, Orientation, and True North
Navigating your map should feel simple and intuitive. SiteMap makes that possible with built-in controls for zoom and orientation. Use the plus and minus buttons to zoom in and out, especially if you’re working on a laptop with a touchpad. For the best experience, a mouse gives you precise control when panning and rotating.
If you rotate the map to get a better view of your site, the compass icon is your reset button. One click brings the map back to true north. This is key when sharing screenshots or collaborating with contractors. It ensures everyone sees the same orientation, which can help prevent confusion and mistakes.
Find My Location: Navigate On Site with Mobile
The Find My Location feature brings SiteMap to life in the field. When you open the mobile app on a phone or tablet, a blue dot shows your exact position and moves with you as you walk. This real-time tracking makes it easy to confirm where you are in relation to utilities, scan boundaries, and imported layers.
This tool works great for facility managers and field crews. It’s useful for inspections, maintenance checks, and safety verifications. You can see your position on the same interactive map used in the office. It’s a simple way to connect planning with execution and keep everyone aligned.
Watch the full Feature Friday recording here to see the toolbar in action.
Backgrounds: Pick the Best Base Map for Your Task

SiteMap offers several background options: Satellite, Dark, and Streets. You can pick the view that makes your utility data easiest to read.
SiteMap offers several background options. You can select the view that suits your project best. The default Satellite + Streets combines aerial imagery with street names. For a clean, high-contrast view, switch to Dark Mode. It makes utility lines stand out. This can be helpful for users who need visual clarity.
Other options include Satellite for a pure aerial view, Streets for a simplified map with road details, and Outdoor, which highlights trails and campus features. Each style serves a purpose: Satellite for real-world context, Dark for precision, and Outdoor for specialized environments like parks or large campuses.
Rendering Scale: Control When Line Work Appears
The Rendering Scale setting determines when utility line work appears as you zoom in or out. By adjusting this control, you can choose whether to display line work at wider views or keep performance optimized at closer zoom levels. Setting a higher threshold lets you view all line work, even when zoomed out. This is useful for large sites or planning sessions. Lowering the scale speeds up rendering when you focus on ground-level details.
This flexibility is useful for facility managers who handle complex maps with multiple layers. It prevents clutter at broad views while maintaining clarity where accuracy matters most.
Desktop vs. Mobile: Pick the Right Tool for the Job
SiteMap performs great on both desktop and mobile. Still, each has its strengths in specific scenarios. The desktop version is ideal for planning, printing, and managing complex projects. It provides accurate control over zooming, rotating, and layering data. This is ideal for office tasks and in-depth analysis.
The mobile app best serves the field. You can access the interactive map right away. It comes with layers, measuring tools, and the Find My Location feature. This means you can walk a site, verify utilities, and make quick decisions without carrying paper maps or switching between apps. Both versions use the same toolbar logic. So, there’s no learning curve when switching from the office to the job site.
Tips for Speed, Clarity, and Clean Records
A few simple habits can make your SiteMap experience efficient:
- Use a mouse for smoother zooming and rotation. While the platform works with a touchpad, a mouse gives you better control for panning, zooming, and rotating the map.
- Keep the render scale near 500 feet for daily work. This setting ensures line work loads without overwhelming your view. It’s the sweet spot for balancing performance and detail during routine tasks.
These small adjustments can help maintain clarity, improve navigation, and keep your records organized.
Why It Matters for Your Team
SiteMap combines all your facility records into one interactive platform. This way, your team has a single source of truth for planning, digging, maintenance, and audits. Instead of juggling multiple files and systems. You can find everything you need organized and accessible. This can improve collaboration and keep your projects moving without delays.
The right toolbar is more than a set of tools; it’s your daily control center. Layers, content, history, measuring, backgrounds, and navigation features work together to simplify complex tasks. Whether you’re managing a small repair or a large-scale expansion, these tools can help you make informed decisions with speed and assurance.
Click below to schedule your live, personal SiteMap demo today!
FREQUENTLY ASKED QUESTIONS
How do I export data from SiteMap?
Exporting is simple. From your Digital Plan Room or Map Viewer, you can download files in formats like DWG, PDF, or orthophotos. This lets you take interactive maps and records from SiteMap into CAD, GIS, or other software without disrupting your workflow.
Can SiteMap scale as my portfolio grows?
Yes. SiteMap was created to accommodate scalability. Whether you oversee a single facility or a nationwide portfolio, the platform merges your data into one interactive system. You can keep adding new projects using the same workflow. This lets you expand without changing your process.
How secure are my records in SiteMap?
SiteMap uses a cloud-based setup with controlled access permissions, so your data stays safe and recoverable. All files, maps, and attachments are stored in one central location. This makes collaboration simple and cuts the risk of losing data.